Last week, we took a look at the city of Avondale, AZ and the Harbor Shores subdivision's 2013 to 2015 pertinent rental market figures.
This week, we will look at rental market statistics in the City of Surprise, AZ.
The break down will focus on the subdivision of Surprise Farms.
We will analyze rental market data from 1st quarter and 2nd Quarter of 2013 and 2014 and compare it with data from 1st Quarter and 2nd Quarter of 2015.
Let's take a look at the data.
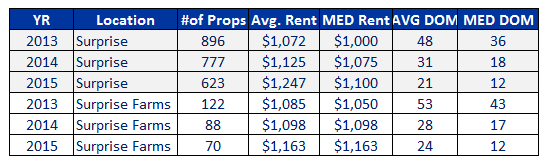
The rental market numbers for Surprise are consistent with the overall 2015 Phoenix Area Rental Market as company. Average rental prices in both Surprise and Surprise Farms have increased from 2013-2015. Rental property inventory has decreased in that time frame.
What is consistent with the Avondale numbers is the Average and Median Days on market figures. Listing time in Surprise has been more than cut in half from 2013. Within the Surprise Farms Subdivision, the average days on market went from 53 in 2013 to a current 24 day number.
In Surprise, average rental property rent rates have increased about 16% from 2013 to 2015 (from $1072 to $1247).
Rental Property inventory in Surprise, AZ has also decreased,
although a precise number will not be computed until the end of the quarter.
The increase in rental price from 2013-2015 in Surprise farms is about 11%.