On the last post, we took a look at the city of Buckeye, AZ and the Festival Foothills subdivision's 2013 to 2015 pertinent rental market figures.

This week, we will look at rental market statistics from 1st and 2nd Quarters 2013-2015 in the City of Phoenix, AZ. All figures are taken from closed rental data from the MLS.
The break down will focus on the subdivision of Desert Ridge.
We analyzed the Phoenix and Desert Ridge rental market data from 1st quarter and 2nd Quarter of 2013 and 2014 and compared it with data from 1st Quarter and 2nd Quarter to date in 2015. The rental property data is from the Arizona MLS and focuses on closed rental properties.
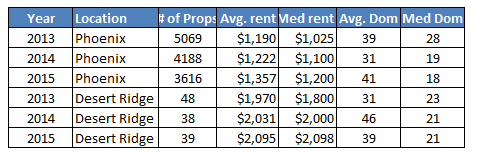
The rental market numbers for the city of Phoenix in this study are consistent with what we have experienced with the overall 2015 Phoenix Area Rental Market. The Desert Ridge rental property data has some interesting quirks but prices still trending upward like the rest of the market although not at the same rate of acceleration.
Overall, average rental prices in Phoenix has increased during this 2013-2015 time period. The average rental price has increase from 2013 to 2015 in Phoenix by $167. the average rental price in Desert Ridge but has only increased by $125. Percentage increase in average rental price from 2013 to 2015 in Phoenix and Desert Ridge was 14% and 6% respectively. Rental property inventory has decreased significantly in Phoenix.
What is interesting about Desert Ridge and Phoenix is that the average days on market has gone up a bit from 2013 to 2015. This differs with many of the markets that we have studied so far.
