On the last post, we took a look at the city of Phoenix, AZ and the Desert Ridge subdivision's 2013 to 2015 pertinent rental market figures.

This week, we will keep the rental market comparison in Phoenix and look at how rental market statistics from 1st and 2nd Quarters 2013-2015 in the City of Phoenix, AZ compare with a different subdivision.
All figures are taken from closed rental data from the MLS. The break down will focus on the subdivision of Dynamite Mountain Ranch.
Dynamite Mountain Ranch is a subdivision that is east of I-17 and north of Happy Valley Road. It has 1,045 homes within the subdivision. From 1/1//2013 to 7/19/2015, there have been 216 homes listed for rent on the Arizona MLS .
Dynamite Mountain Ranch is a subdivision that is east of I-17 and north of Happy Valley Road. It has 1,045 homes within the subdivision. From 1/1//2013 to 7/19/2015, there have been 216 homes listed for rent on the Arizona MLS .
We will focus on the rental homes listed in quarters 1 and 2 and break down the resulting rental data by year.The rental property data we look at from Phoenix and Dynamite Mountain Ranch focuses on closed rental properties.
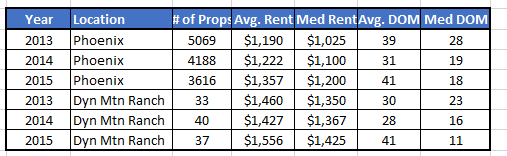
The rental market numbers for the city of Phoenix in this study are consistent with what we have experienced with the overall 2015 Phoenix Area Rental Market.
The Dynamite Mountain ranch rental property data shows some decent gains and rental prices are trending upward. Median days on market regarding these rental properties are showing some sharp declines which is good for landlords.
Overall, average rental prices in Phoenix has increased during this 2013-2015 time period. The average rental price has increase from 2013 to 2015 in Phoenix by $167. The average rental price in Dynamite Mountain Ranch went up $94.
